
PENNSYLVANIA, USA — You've seen it on TV, online, in the newspaper, and even at a former president's desk.
But the most used and relied upon graphic for a hurricane's forecast track is often the most misinterpreted (one could say misleading, but if you do your research you'll understand it).

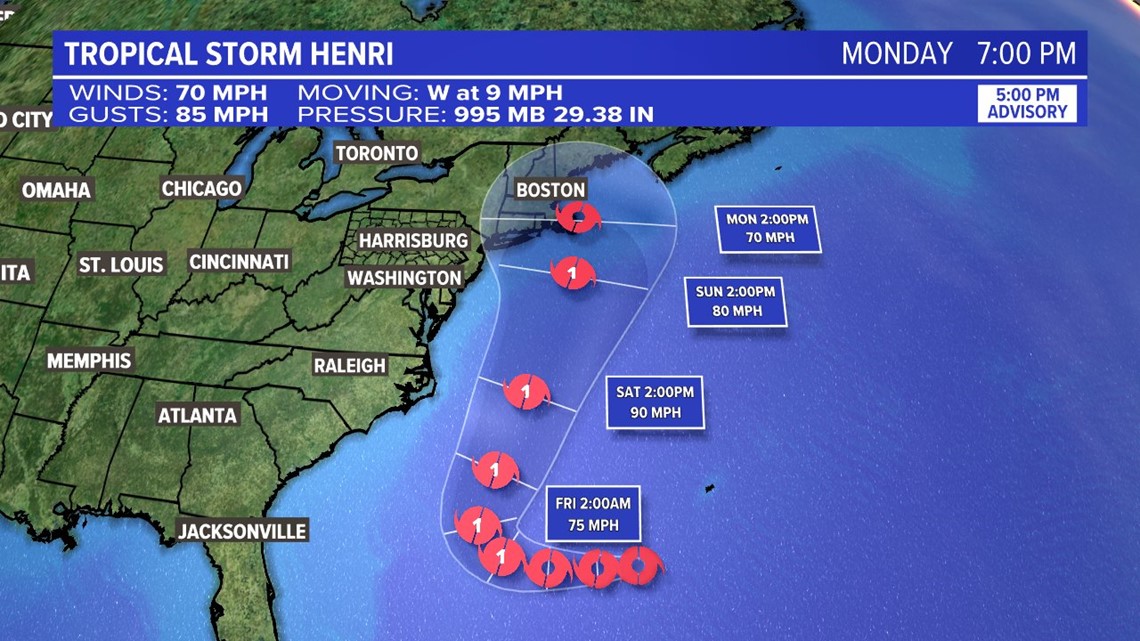
The picture above is from the Aug. 16 5 p.m. update of then Tropical Storm Henri. It's issued by the National Hurricane Center; we just alter it slightly to match our own graphic look, but the data is the same.
We refer to this, in other terms, as the forecast "cone." It represents the probable track of a tropical system in 12-hour segments. While it depends on the system, the forecast cone can go up to five days out.
But, a lot can change in a short amount of time.
Our best forecast certainty holds true within three days or so, and then confidence slowly declines day-by-day. By the time you reach day five, we're confident in our one forecast, but more often than not say, "we're still watching this for more consistency in the models," etc. There are too many atmospheric variables at play to give an on-the-dot forecast, rather than a pretty good idea, by the end of the seventh day. Anything beyond that is pure guesswork and not really based in the spirit of meteorology.
But because of that, you'll notice the ends of the forecast cones get wider, more broad. On our graphic, the end of the cone is more transparent on the inside. It's the same on the National Hurricane Center's as well. That's really where the "uncertainty" portion of the "cone of uncertainty" comes in.

You see, the center of a storm remains in the storm cone much more often than not. It's based on the past five years of data of storms, current weather conditions, and more, according to the National Hurricane Center. However, the effects of the storm often overreach the cone itself. That's because the forecast track is just that: the forecast for the center of the storm, not it's far-reaching effects of showers, storm surge, etc. It's a good idea where the worst could hit, but not where all of the impacts will be felt.
And it doesn't help that this cone changes multiple times every day. Take Henri for example. Five days out, the center of the cone is over Martha's Vineyard and Cape Cod. By 24 hours out, it's over western Connecticut. But, it made landfall further east. There's uncertainty there.
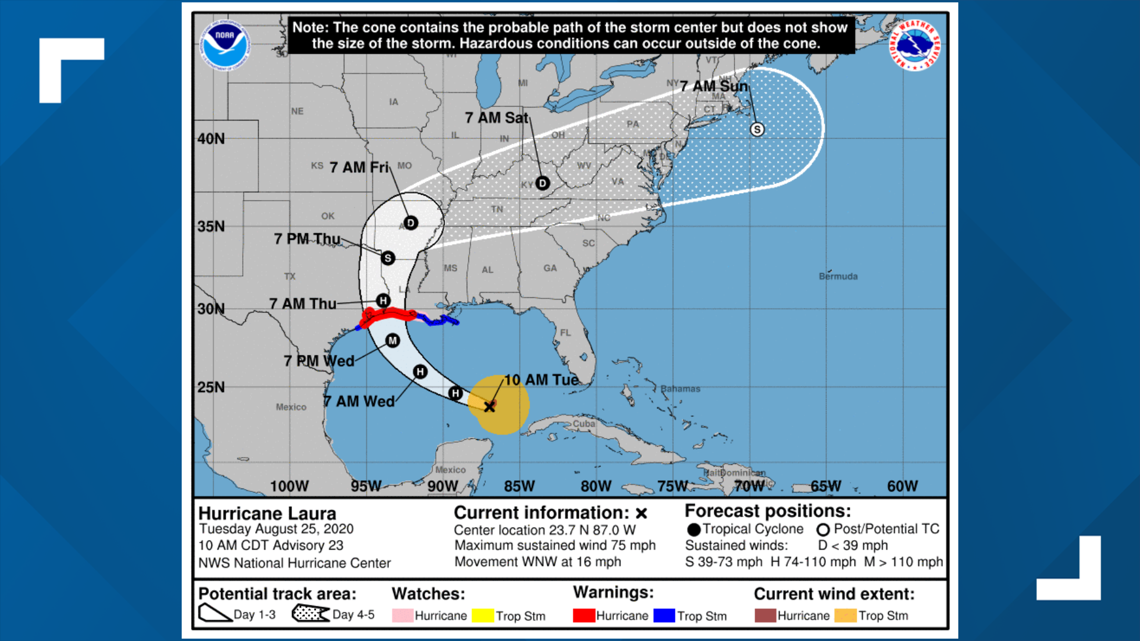
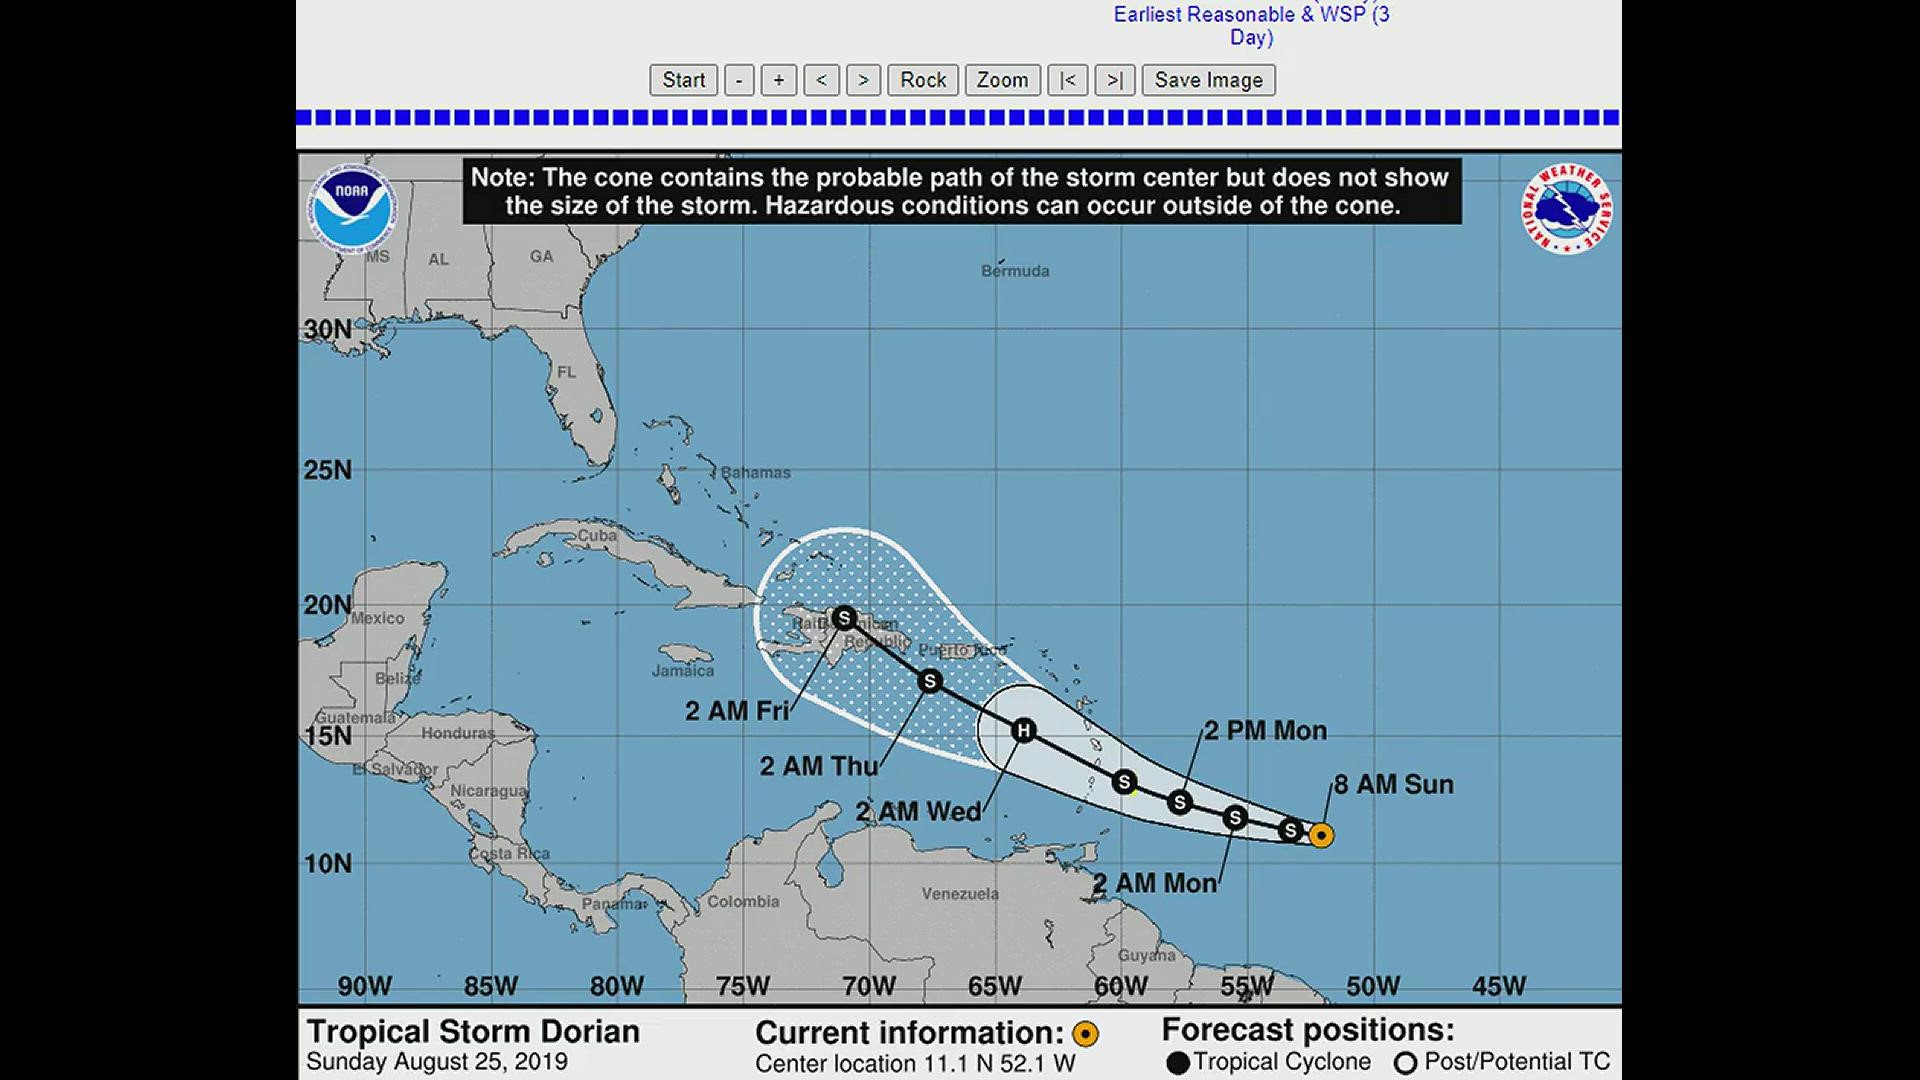
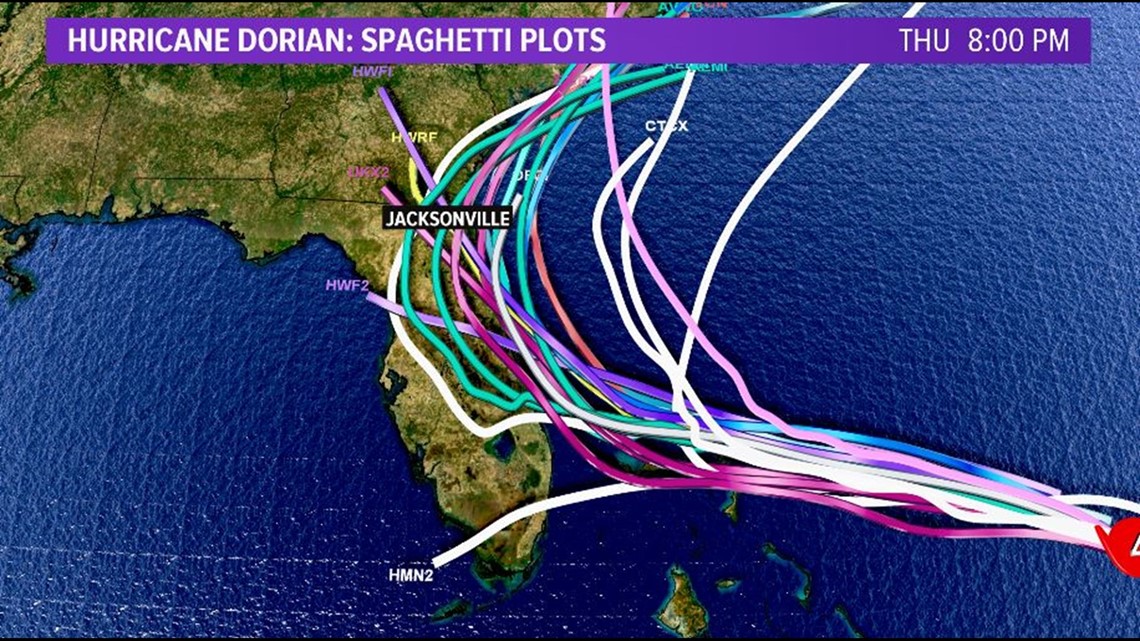
Here's an example of how a forecast track can change, back with Hurricane Dorian in 2019.
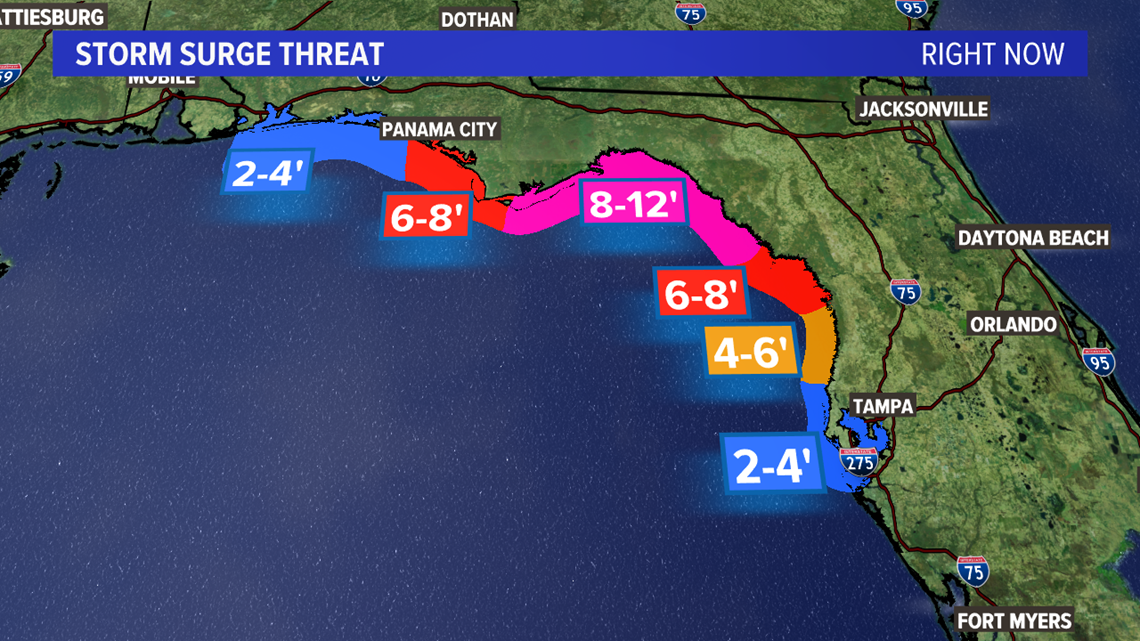
The bottom line here, is know that just like any forecast, the forecast cone, or cone of uncertainty, changes. It specifically gives a most-likely path of the center of the storm, but does fail to talk about the entire breadth of damage. The National Hurricane Center puts out other forecast maps for threats that we use on-air in our own versions as well, including probability of tropical storm force winds, storm surge potential, and more.


It all combines to form a complete picture, just like multiple weather graphics in my weather segments tell the complete story of what to expect day-by-day.
Now, researchers at Colorado State University think they are coming up with a better way to communicate the threat.
They've designed a tool using a series of moving dots, what they call "zoomies," to show potential forecast path. The assumption here is this is different than just throwing out the spaghetti plot showing every single model-run and potential. Below is an image of a spaghetti plot of Dorian from our sister station, First Coast News.

There's a bit more forecasting here than that. Below is an example of what they're coming up with.
You can find more information on their research on Colorado State University's website.
Until next time,
-Chief Meteorologist Bradon Long